

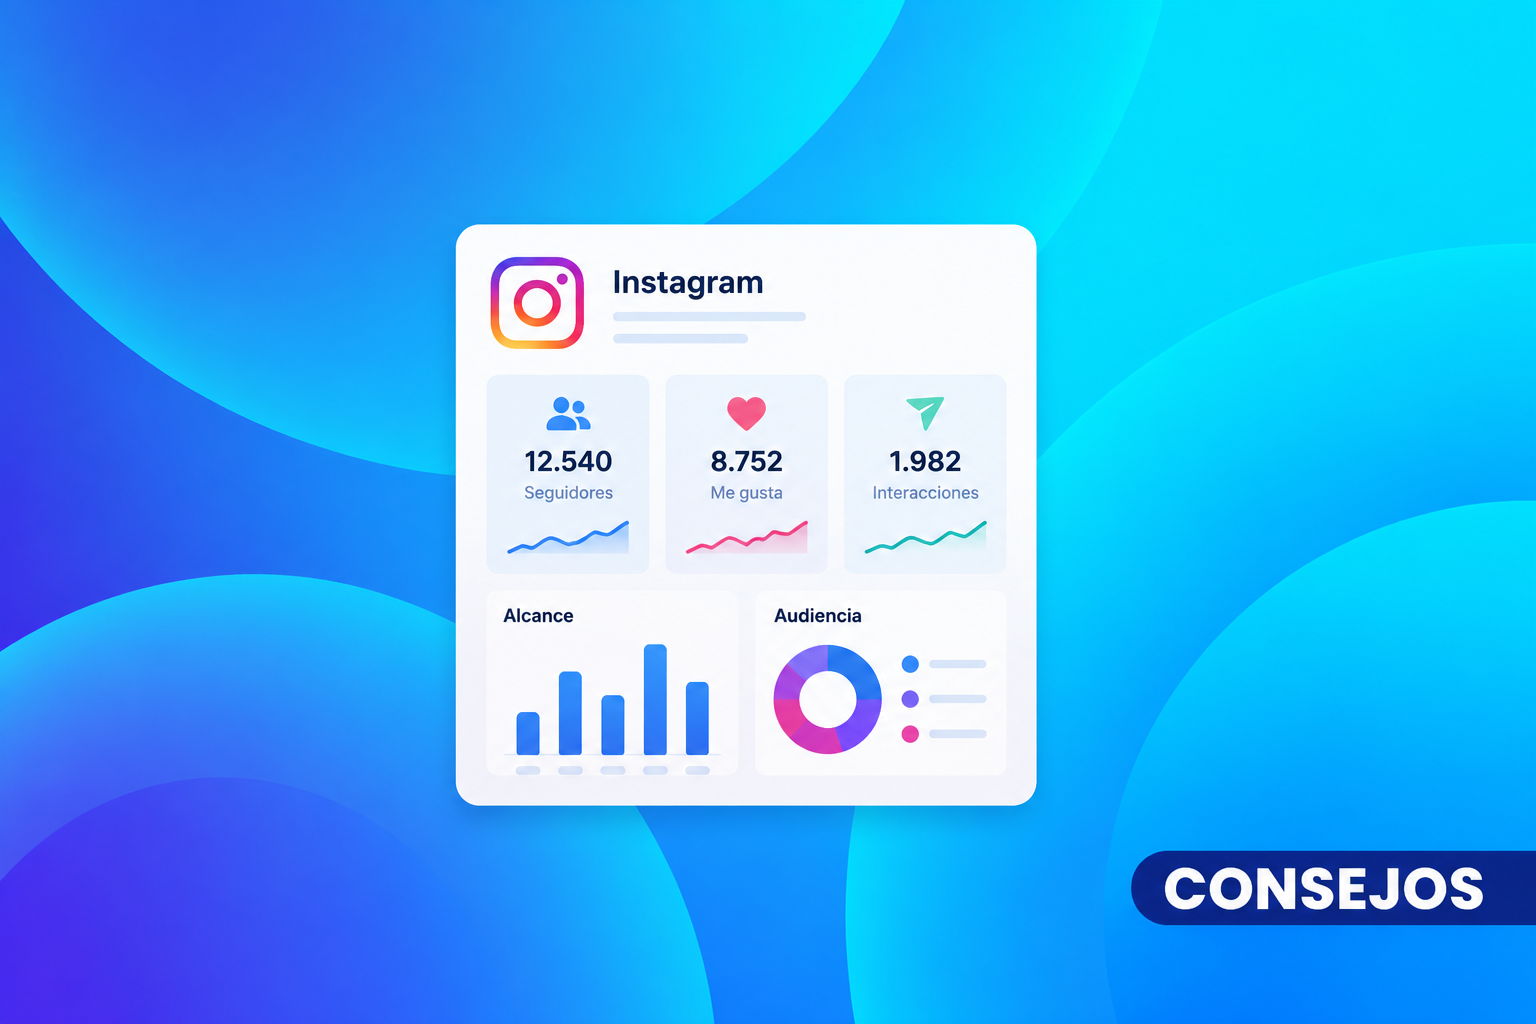
An Instagram report is a structured document that gathers an account’s key metrics over a given period —weekly, monthly, or per campaign— and interprets them based on business objectives. It’s not just a list of numbers: it’s a narrative that connects data with concrete decisions. For digital marketing agencies and freelancers managing multiple clients, a well-built Instagram report demonstrates professional judgment, justifies the strategy, and helps with client retention.
What is an Instagram report and what is it for?
An Instagram report consolidates organic performance data, content data, and, when applicable, paid campaign data, to answer one central question: what happened and why does it matter? Unlike a simple metrics screenshot, a well-structured report includes comparative context, root-cause analysis, and actionable recommendations.
For an agency, the monthly Instagram report serves three functions at once:
- Client management: shows that the work is being executed with judgment and that results are monitored systematically.
- Decision-making: allows content strategy, budget, and formats to be adjusted based on real data.
- Transparency: distinguishes organic results from paid ones and ties each metric to the goal defined at the start of the period.
The roles that most need to master this process include community managers who report to direct clients, performance managers who combine organic with Meta Ads, and agency owners looking to standardize their deliverables.
What metrics to include in an Instagram report
The metrics that should appear in the report depend on the account’s goal. However, there’s a base set that applies in most cases.
Reach and visibility metrics
- Reach: number of unique accounts that saw the content.
- Impressions: total number of times the content was shown, including repeat views.
- Profile visits: indicator of interest generated beyond the feed.
- Clicks on the bio link: intent metric when posts don’t have a link feature.
Engagement metrics
- Engagement rate: percentage of people reached who interacted (likes, comments, saves, shares).
- Saves: signal of content perceived as high-value by the user.
- Shares: indicator of content with viral potential or high impact.
Growth metrics
- Followers gained and lost: always show the net figure, not just the cumulative total.
- Monthly growth rate: more useful than the absolute number for accounts at different stages.
Metrics by format
| Format | Main metric | Secondary metric |
|---|---|---|
| Reels | Plays | Retention rate |
| Carousels | Reach | Swipe-through rate |
| Stories | Impressions | Exit rate per screen |
| Static posts | Reach | Engagement rate |
If the account ran Meta Ads campaigns during the period, spend, paid reach, CPM, CPC, and conversion metrics should appear in a separate section. Mixing organic results with paid ones distorts the analysis and confuses the client.
Common mistakes when building an Instagram report
Reporting vanity metrics without context
Saying reach was 50,000 impressions provides no value if the client doesn’t know whether that’s high, low, or the same as the previous month. Every metric needs a point of comparison: previous period, agreed-upon goal, or industry benchmark.
Not separating organic and paid traffic
If there was ad spend, that distinction must be explicit. An increase in reach driven solely by paid promotion doesn’t reflect the actual performance of the organic content strategy.
Describing without analyzing
The most common mistake in agency reports is listing what happened without explaining why it happened or what will be done differently. A report that doesn’t generate recommendations is just a historical file.
Ignoring underperforming content
Showing only the posts with the best results skews the reading. Including content that didn’t work —with a hypothesis about the cause— shows analytical judgment and sparks valuable strategic conversations.
How to structure an Instagram report step by step
- Define the period and the goals of the report. Establish whether the report is monthly, per campaign, or weekly, and tie each section to the KPIs agreed upon with the client at the start.
- Write the executive summary first. Include the two or three most important data points of the period. It should be readable in under 30 seconds and give a clear picture of the account’s status.
- Add comparative context. Compare the metrics with the previous period and with the defined goals. Without comparison, the numbers are just isolated figures.
- Organize the metrics by section. Use the order: reach and impressions, engagement, follower growth, performance by format. Each section should have a clear heading.
- Include content analysis. Show the three best-performing posts and the three worst-performing ones. For each, add a hypothesis about why it worked or didn’t.
- Add the ads section if applicable. Report total spend, paid reach, CPM, CPC, and conversion results. Keep this section separate from the organic analysis.
- Close with conclusions and next steps. Formulate at least two or three concrete actions for the next period. This section turns the report into a management tool, not just documentation.
How to present the Instagram report to a client
Use simple, consistent visualizations
Line charts work well for showing evolution over time. Bar charts are clearer for comparing formats or posts against each other. Avoid pie charts for metrics that aren’t proportions of a whole.
Adapt the language to the client
Not every client knows terms like CPM, engagement rate, or organic reach. The first time a technical term appears, include a brief definition in parentheses or in a footnote.
Highlight achievements with context
A 20% increase in reach is only relevant if it’s connected to the goal defined at the start of the period. Without that context, the client can’t assess whether the result is satisfactory or insufficient.
Always end with next steps
The report shouldn’t raise questions about what the numbers mean. It should spark conversations about what to do with them. Before sending the report, answer this question: what decision should the client be able to make after reading it?
Tools like Master Metrics make it possible to automate the collection of Instagram and other platform data into a unified dashboard, eliminating the manual work of exporting metrics and building tables from scratch every month. This cuts report preparation time by up to 50% and lets the team focus on analysis, not data consolidation.
Instagram report vs. other reporting options
| Criteria | Manual report (spreadsheets) | Looker Studio | Master Metrics |
|---|---|---|---|
| Preparation time | High (2-4 hours per client) | Medium (requires initial setup) | Low (automated from month one) |
| Data updates | Manual | Automatic with connectors | Automatic and centralized |
| Learning curve | Low | Medium-high | Low |
| Multi-client | Hard to scale | Possible with templates | Designed for multi-client agencies |
| Meta Ads integration | Manual | Yes, with a paid connector in some cases | Native |
| Entry cost | Zero | Free (with limits) | Depends on plan |
Frequently asked questions about the Instagram report
How often should the Instagram report be sent to a client?
The most common frequency is monthly, since it allows trends to be observed with enough data volume. However, accounts with high activity or active campaigns may require biweekly or weekly reports. What matters is agreeing on the frequency with the client at the start of the contract and keeping it consistent.
What’s the difference between reach and impressions on Instagram?
Reach measures the number of unique accounts that saw the content. Impressions measure the total number of times that content was shown, including multiple views by the same user. A high ratio between impressions and reach indicates that part of the audience saw the content more than once, which can be positive or negative depending on the goal.
What is engagement rate and how is it calculated?
Engagement rate is the percentage of people reached who interacted with the content through likes, comments, saves, or shares. The most commonly used formula is: (total interactions / reach) × 100. Some analysts calculate engagement based on total followers, but the reach-based formula is more accurate for assessing content quality.
How do you separate organic results from ads results in the report?
The clearest way is to dedicate separate sections to each type of traffic. The organic section reports reach, engagement, and follower growth generated without spend. The ads section details total spend, paid reach, CPM, CPC, and conversions. Mixing both without distinction leads to misleading readings of the content strategy’s actual performance.
Which Instagram metrics matter most for an e-commerce business?
For e-commerce accounts, the most relevant metrics are clicks on the bio link, referral traffic from Instagram to the website (visible in GA4), profile visits, and, if Instagram Shop is enabled, product views and clicks on product tags. Engagement rate is secondary if the main goal is generating traffic and sales.
How many posts should I analyze in the featured content section?
It’s recommended to include between three and five best-performing posts and three worst-performing ones during the period. For each, add a main metric (reach or engagement rate) and a brief hypothesis about the factors that influenced the result. This turns content analysis into a strategic input for the next period.
How does Master Metrics help prepare the Instagram report?
Master Metrics automatically connects Instagram data with data from other platforms like Meta Ads, Google Ads, and GA4 into a single dashboard. This eliminates the need to manually export metrics from each tool and build tables from scratch. Agencies managing multiple clients can generate updated reports in minutes, with period-over-period comparisons and visualizations ready to present to the client.
Conclusion
A well-built Instagram report is much more than a summary of metrics: it’s the tool that connects day-to-day execution with business goals. Including the right metrics, organizing them with a clear structure, and presenting them with comparative context is what separates a report the client files away from one that drives concrete decisions.
For agencies handling several clients at once, the biggest challenge isn’t knowing what to report but how much time it takes to do it manually. Automating data consolidation with a tool like Master Metrics lets the team spend that time on analysis and recommendations, which are the real differentiating value an agency offers a client.
The next step is to review the report you currently deliver to your clients and ask yourself whether anyone —without technical knowledge— could read it and know exactly what happened, why it happened, and what will be done about it. If the answer isn’t immediate, the structure and tools you use to build it have room for improvement.





